Historical Trend
■ Control appearance
■ Description
This control display the historial trend of selected tagnames.
This control has a limit on the minimum width. When performing viewer display, the aspect ratio may not be maintained.
□ Data Type
You can select the tag and data type to display the trend graph from the detailed property.
There are two types of data: real time and historical.
In real time mode, the graph displays data in seconds in the range of "10 minutes" to "1 day", and in the case of historical, data in minutes in the range of "30 minutes" to "1 year".
□ Data Extracting
This control will thin out the data at fixed intervals if the amount of data displayed as a graph is over the width of the component. You can set the data extracting method from the display setting window.
Data thinning is applied when the display width of the graph is 1 hour or more if the data type is real time, and is applied when the display width is 3 days or more for the historical type.
■ Events
The following table is a list of events that can be used with this control.
| Event name | Value | Description |
|---|---|---|
| !onTimeChange | string value |
This event occurs when the time span is changed. Output the selected time span (the elapsed time in milliseconds since 1970) to the variables set in the variable link in the following format. "Start time", "End time" |
■ Properties
The following table is a list of properties that can be used with this control.
For common properties for each component, see the common items page.
| Property name | Default Value | Description |
|---|---|---|
| BeginEndTime | The elapsed time in milliseconds since 1970 of “0:00,23:59”of the current day. |
Set the begnning and ending time in the values of milliseconds since 1970 in the following format. "Start time", "End time" If the ending time is not set, it will be set to the current time automatically. It is recommended to use the !onSelect event output of the calendar component to specify this property. |
| bFireWhenTimeChanged | false | Sets whether !onTimeChange event is triggered when the value of BeginEndTime changes due to factors other than mouse/touch operation of this control. |
■ Functions
The list of available functions.
For common functions of the components, see the common items page.
You can use this + ".FunctionName" in the JavaScript area to call this function.
| Function Name | Argument | Return Value | Description |
|---|---|---|---|
| getBeginEndTime | - | string value |
Get the begnning and ending time of the displayed time span in the values of milliseconds since 1970 in the following format. "Start time", "End time" |
| setBeginEndTime | string value | - |
Set the begnning and ending time in the values of milliseconds since 1970 in the following format. "Start time", "End time" If the ending time is not set, it will be set to the current time automatically. The specified values are internally rounded off in minutes. |
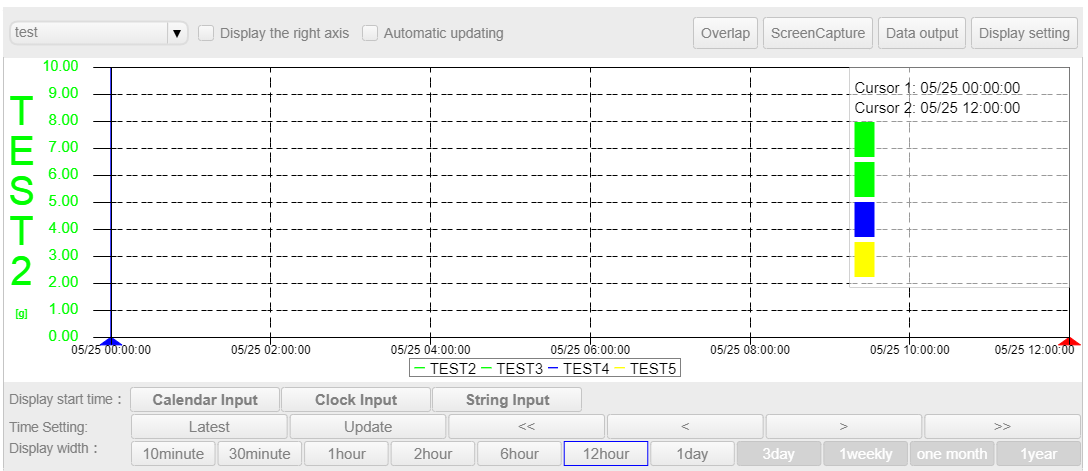
■ Trend graph screen
□ Graph selection combo box
You can select the graph to display.
□ Right axis display setting check box
Select to show / hide the right axis of the graph.
□ Automatic update check box
Check the check box to start automatic update, and uncheck it to end automatic update. The update cycle can be set in the advanced setting properties.
When the check box is checked, the display date can not be set in the display start date and time combo box.
□ Overlap Button
Press the Overlap button to display the Overlap Display setting window.
In the Overlap Display setting window, set the start time when to show the overlap data, and check the overlap display checkbox, the data from the start time will display in the graph as dotted line which overlaps the current graph.
□ Screen capture
When the Screen Capture button is pressed, the screen capture dialogbox is displayed.
Set the file name in the dialogbox, and press the Download button to download the image file of the currently displayed graph.
□ Data output button
When the data output button is pressed, the displayed graph data is output as a CSV file.
□ Display setting button
When the display setting button is pressed, the display setting window is opened.
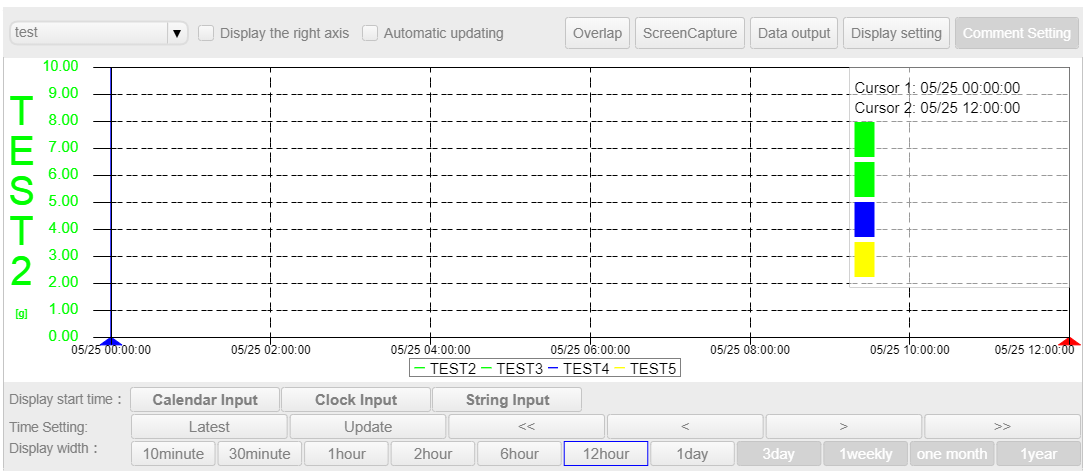
□ Comment setting button
When the comment setting button is pressed, the comment setting window is opened.
□ Graph name display label
Displays the display name of the graph display target area set in the advanced property. By clicking on the display name, the graph is highlighted and the display of the Y-axis is switched.
If the display of the right Y-axis is valid, drag the cursor 2 and then click the display name to apply the Y-axis of the selected graph to the right Y-axis; otherwise, the Y axis of the selected graph is applied to the left Y-axis.
□ Display start date and time button
Set the display start date and time, and press the update button to change the display start date and time.
□ Latest button
Display the latest graph up to the current time.
□ Update button
Click to display the graph again according to the graph settings.
□ << button
Return the display start date and time by the display width of the graph and display the graph again.
□ <button
Return the display start date and time by one division of the graph and display the graph again.
□> button
Advances the display start date and time by one division of the graph and displays the graph again.
□ >> button
Advances the display start date and time by the display width of the graph and displays the graph again.
□ Time width switching button
Switch the graph display width in the range of "10 minutes" to "1 year".
If the graph type is real time, you can switch within the range of "10 minutes" to "1 day".
If the graph type is historical, you can switch within the range of "30 minutes" to "1 year".
The type of graph can be set from the advanced properties.
□ Cursor 1 · Cursor 2
The cursor is moved by dragging the lower ▲ part. You can check the value of each graph at the dropped position in the display setting window.
When you drop the cursor, a panel is generated at the top opposite the cursor position, and the panel displays the cursor time and the value of each graph of that time.
After moving each cursor, click at the left and right side of the lower ▲ marker to move the cursor by one data.
■ Detail property
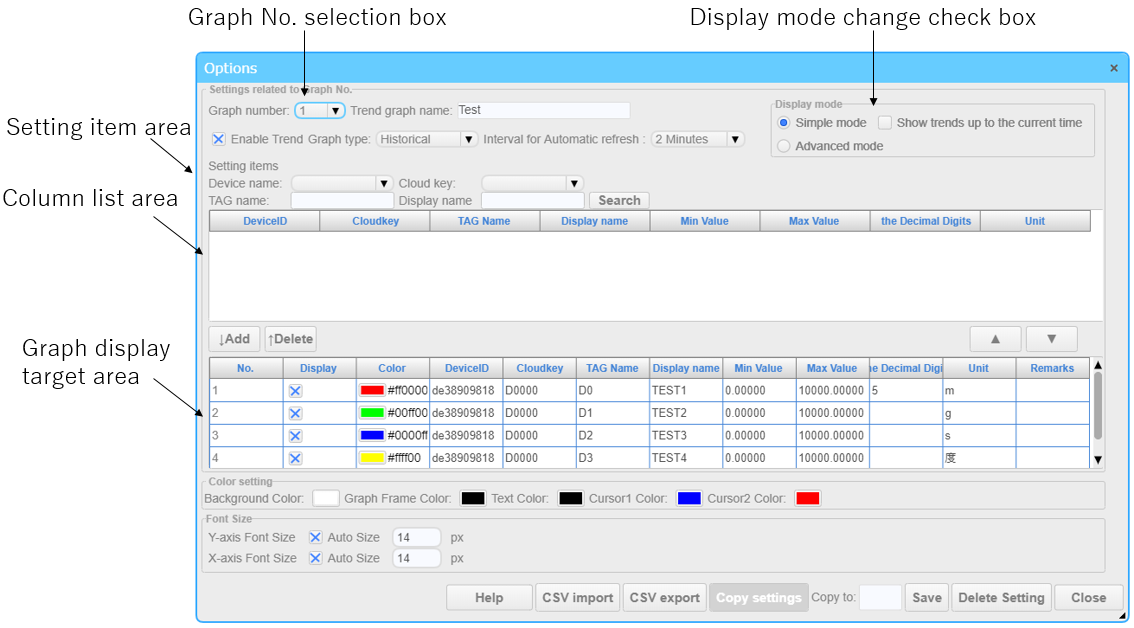
The advanced properties allow you to configure the graph to be displayed.
□ Graph No. selection box
In the graph No. selection box, set the graph whose setting is to be changed.
□ Graph name input area
In the graph name input area, set the graph name. The graph name can be set up to 20 characters.
□ Trend enabled
For trend enable, set whether to display this graph in the graph selection combo box.
□ Graph type
Select the type of trend line. The real-time trend displays real-time data in seconds. Historical trend displays the trend line of historical data in minutes unit.
□ Automatic update interval
Automatic update interval sets the update interval for automatic update.
■ Setting item area
In the setting item area, you can set the data to be displayed in the column list area.
□ Device name
Update the cloud key combo box by setting the device name.
□ Cloud key
By setting the cloud key, the tag name display table is updated.
□ TAG name, display name, search
With TAG name, display name, and search, while the tag name list area is displayed, enter the TAG name or display name or both, and press the search button to search for the tag name containing the entered characters.
■ Column list area
□ TAG name
The tag name is displayed.
□ Display name
The data item name is displayed.
□ Number of decimal places
The number of decimal places is displayed.
□ Unit
The unit is displayed.
□ Add button
Select any line in the tag name list area and press the Add button to add tag names to the graph display area.
□ Delete button
Select any row in the chart display table and press the Delete button to delete the selected row.
■ Graph display target area
□ No.
The graph number is displayed.
□ Display
Display a graph with a check in the check box. If there is no check, the graph is not displayed.
□ Color
Click to open a color selection window.
□ TAG name
The TAG name is displayed.
□ Display name
The data item name is displayed.
□ Minimum value
You can set the minimum value of the graph by entering a numerical value.
□ Maximum value
You can set the maximum value by entering a number.
□ Number of decimal places
You can set the number of decimal places by entering a number.
□ Remarks
You can set the remarks for this graph by entering a string.
□ Save
The settings are saved and reflected by clicking. If you do not save it, the settings will not be reflected.
■ Color setting
Sets the color of the control.
□ Background color
Set the background color.
□ Color of graph frame
Set the color of graph frame, grid lines and scale.
□ Text color
Sets the color of the text displayed in the graph.
□ The color of cursor 1
Set the color of cursor 1.
□ The color of the cursor
Set the color of cursor 2.
■ Font Size
□ Y-axis Font Size
Set the font size of the Y-axis scale.
□ X-axis Font Size
Set the font size of the X-axis scale.
□ Size of the calendar
This can be set when the display mode is advanced mode. Set the calendar size for setting the display start date and time.
■ Display mode change check box
Switch the display of parts.
□ Simple mode
In the simple mode, the time width change button and the display time operation button are displayed briefly, and the display start date and time are set automatically.
□ Detail mode
In the detail mode, you can set the start date and time of the trend with more options, including using the Year, Month, Date, Time, Minute and Second combo box.
□ Simple mode display time setting check box
Set the display start time in simple mode. When checked, set the display time so that the current time is at the right end of the graph.
When unchecked, set the display time to include the current time.
□ Automatic selection of graph type
In advanced mode, the graph type is automatically selected. If there is data in seconds corresponding to the time displayed in the graph and the time width of the graph is not 1 month or 1 year, set the graph type in real time.
Otherwise, set the graph type to historical.
■ Display setting window
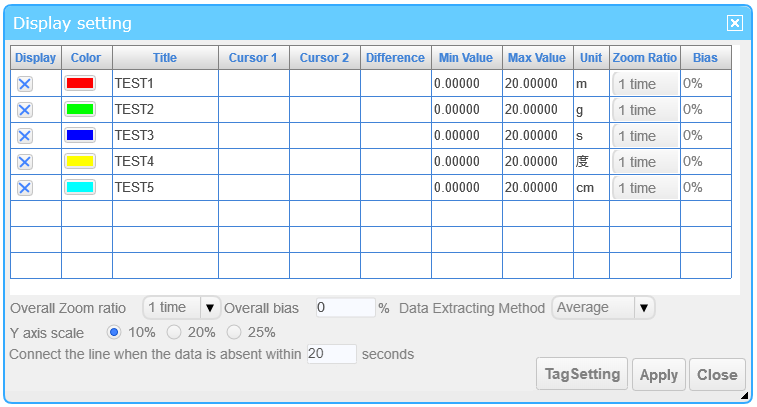
In the display setting window, you can make settings for graph display and check cursor values. You can also perform other operations while displaying the display setting window.
■ Graph setting table
□ Display
You can set display / non-display of each graph.
□ Color
The color set in the "Advanced Properties" Dialogbox is displayed.
□ Title
The display name of the graph is displayed.
□ Cursor 1
Display the value of each graph at cursor 1 position.
□ Cursor 2
Displays the value of each graph at cursor 2 position.
□ Difference
Displays the value difference beween cursor 2 and cursor1 for each graph.
□ Unit
Display the unit of the graph.
□ Magnification
Set the magnification of each graph.
□ Bias
Set the bias of each graph in Y-Axis.
□ Overall zoom rate
Sets the enlargement factor of the whole graph.
□ Bias
Sets the bias for the entire graph in Y-Axis.
□ Data extracting method
Set the data thinning method. Data thinning is applied when the display width of the graph is 1 hour or more if the data type is real time, and is applied when the display width is 3 days or more for the historical type.
If the average is selected, the average value of data is displayed at each thinning interval.
When Maximum is selected, the maximum value of data is displayed at each thinning interval.
When the minimum is selected, the minimum value of data is displayed at each thinning interval.
When the direct value is selected, the interval for thinning the graph is calculated from the size of the display area of the graph, and data is acquired at intervals calculated from the start time.
If there is no data, it gets the data of the closest time between the intervals.
The intervals for thinning out non-integer data are as shown in the following table.
| Time | Interval of thinning |
|---|---|
| 1 hour | Every 2 seconds |
| 2 hours | Every 5 seconds |
| 6 hours | Every 15 seconds |
| 12 hours | Every 30 seconds |
| 1 day | Every 1 minute |
| 3 days | Every 2 minutes |
| 1 week | Every 5 minutes |
| 1 month | Every 30 minutes |
| 1 year | Every 6 hours |
□ Y axis scale
You can set the Y-axis scale interval.
□ Connect the line when the data is absent within XX seconds
If the blanks in the obtained data fall within the times specified here, the trend will be plotted in continuous line.
The default setting is "20 s". If set to "0 s", the trend will not be drawn in continuous line if there is blank data.
□ Zoom in/out
Drag and drop the mouse to specify a range to expand the display to the specified area.
The original display can be restored by resetting the “Time range displayed”.
The minimum display width is 1 minute for real-time and 10 minutes for historical data.
□ Tag setting button
Press the Tag setting button to open the Tag setting window.
■ Tag setting window
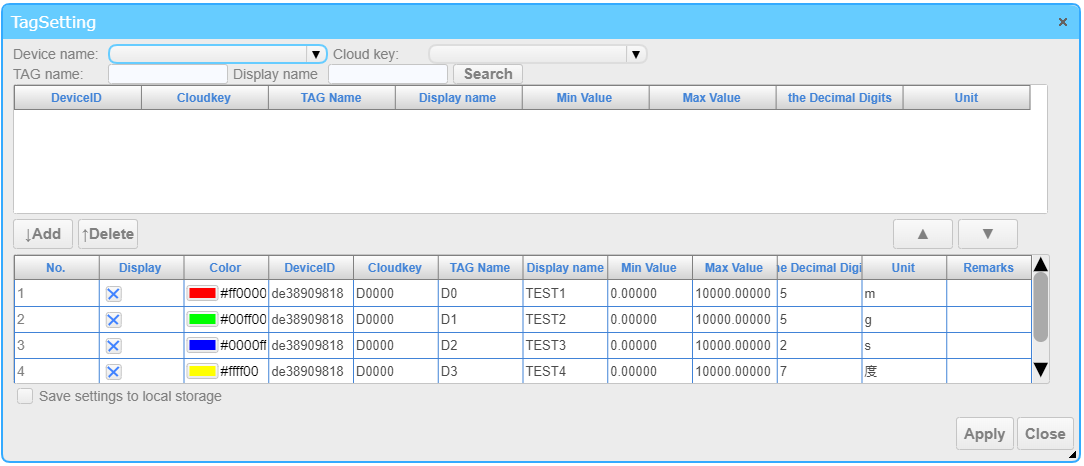
In the Tag Settings window, you can change the settings in the detailed property settings area.
□ Save settings to local storage
Sets whether or not to save the modified settings of the Tag Settings window to the local storage. The default setting is "Disabled".
If enabled, settings saved in the local storage will be displayed first after the page is reloaded.
If disabled, after reloading the page, the original settings (before the changes of the Tag Settings window) are used.
■ Comment setting window
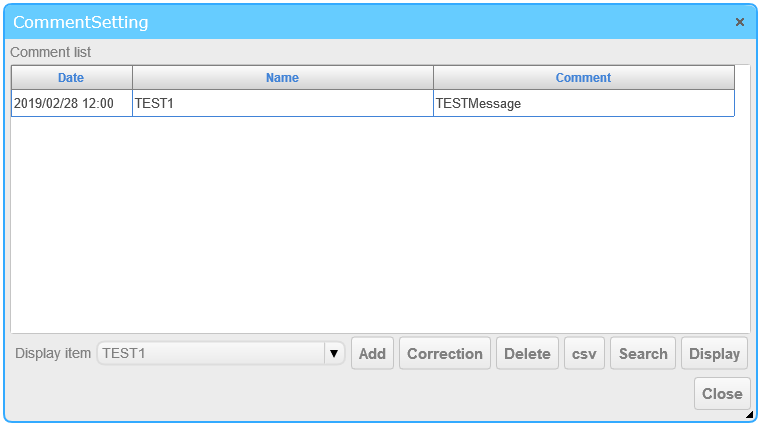
In the Comment Setting window, you can set the comments displayed on the graph.
□ List of comments
Displays a list of comments set in the graph.
□ Display item
You can select the graph to which you want to add a comment.
□ Add button
Select a graph from the displayed item selection box and click the button to open the comment input popup window.
□ Comment input pop-up window
In the comment input popup window, add a comment.
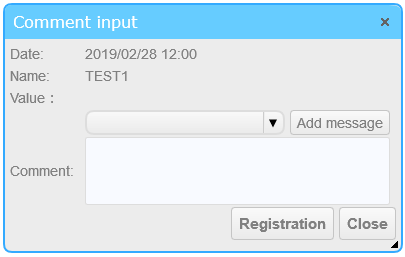
□ Date
Displays the time to add a comment. This time is the time when cursor 1 is displayed.
□ Name
Displays the name of the graph to which you want to add a comment. This value is the value of the displayed item.
□ Value
Display the value of the selected graph.
□ Fixed phrase addition combo box
You can select fixed phrases to be added to the comment.
□ Add button
Add the fixed phrase selected in the fixed phrase add combo box to the comment.
□ Comment input text area
You can edit the comment.
□ Registration button
You can add the configured comment.
□ Correction button
If you select the item you want to correct from the comment list and click the correction button, the comment correction popup window will open.
□ Comment correction popup window
The Comment correction pop-up window corrects the comment.
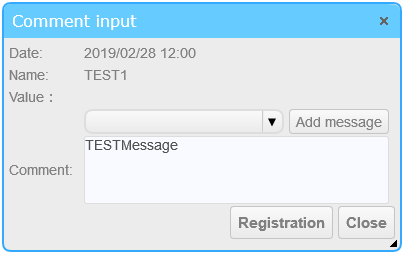
□ Date
Displays the time of the selected comment.
□ Name
Displays the name of the selected comment.
□ Value
The value of the selected graph is displayed.
□ Fixed phrase addition combo box
You can select fixed phrases to be added to the comment.
□ Add button
Add the fixed phrase selected in the fixed phrase add combo box to the comment.
□ Comment input text area
You can edit the comment.
□ Registration button
You can register the corrected comment.
□ Delete button
If you select a comment to delete from the comment list and click the delete button, a delete confirmation message will be displayed, and if you select Yes, the selected comment will be deleted.
□ csv button
Output a CSV file of the comments displayed in the comment list.
□ Search button
Click to open the comment search popup window.
□ Comment search popup window
Comment Search pop-up window, search for comments.
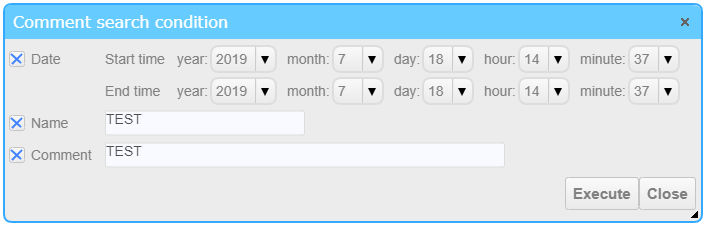
□ Date check box
When the checkbox is checked, you can use the combo box to set the date period to search.
□ Name check box
When the check box is checked, you can use the text box to set the name to search for.
□ Comment check box
When the check box is checked, you can use the text box to set the comment to search for.
□ Execute button
Click the button to search for the item being checked.
□ Display button
Select the item you want to display from the comment list, and click the button to display a graph of the date the comment is displayed.