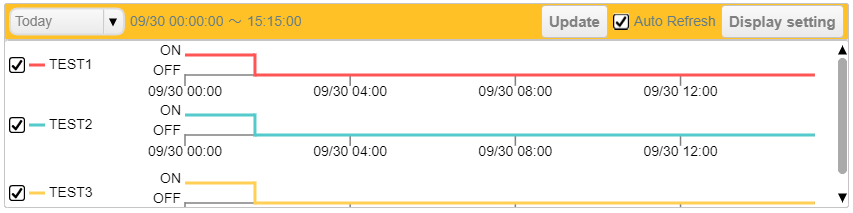
ON/OFF Trend
■ Control appearance
■ Description
Display the ON (non-zero)/OFF (zero) trend of device tags.
This control has a minimum width limit; the aspect ratio may not be preserved when the browser size is changed.
□ Time range displayed
Select the graph display period from the combo box at the top of the part. The selecting options are "Today", "Last 7 days", "This Week", and "Specify time".
If "Today" is selected, the data of today will be displayed.
If "Last 7 days" is selected, the data for the last 7 days will be displayed.
If "This week" is selected, the data from 00:00 of the last sunday to current time will be displayed.
If you select "Specify Time," the start and end times are editable in the calendar by clicking on them. The graph will be displayed up to the set start and end time. The minimum time period that can be displayed is 5 minutes and the maximum is 7 days.
□ Auto Update Check Box
Checking the checkbox starts automatic updates and unchecking the checkbox ends automatic updates. The update cycle can be set in the Advanced Settings property.
□ Display setting button
The Display Settings button opens the Display Settings window.
■ Display settings window
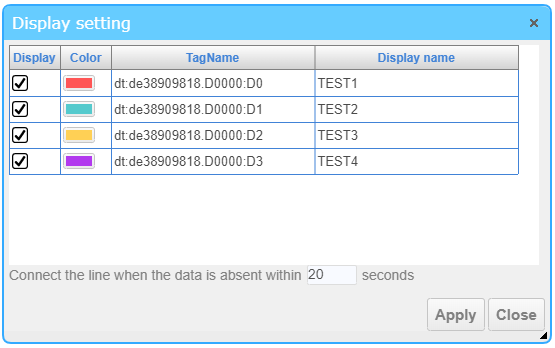
In the Display Settings window, you can enable the disabled graph of tags.
□ Display
Set to show or hide trend charts for certain tags.
□ Color
The color set in Advanced Properties is displayed.
□ TagName
Display the tagname used in the graph. No changes can be made.
□ Display name
Set the display name of the trend.
□ Connect the line when the data is absent within XX seconds
If the blanks in the obtained data fall within the times specified here, the trend will be plotted in continuous line.
The default setting is "20 s". If set to "0 s", the trend will not be drawn in continuous line if there is blank data.
□ Zoom in/out
Drag and drop the mouse to specify a range to expand the display to the specified area.
The original display can be restored by resetting the “Time range displayed”.
□ Graph Display checkbox
Enables/disables trend display.
□ Data Type
Data types include real-time (in seconds) and historical (in minutes), which are automatically selected based on the display time.
If there is data in seconds corresponding to the time displayed in the graph, the second data is used.
□ Data extracting
If the amount of data to be displayed as a graph is large, this control will thin out the data at regular intervals. The data is thinned out by calculating the interval between graphs based on the size of the graph display area and acquiring data at intervals calculated from the start time, i.e., direct value thinning.
Data thinning is applied when the display width of the graph is larger than 30 minutes for real-time data type, and when the display width is larger than 1 day for historical data type.
■ Events
The following table is a list of events that can be used with this control.
| Event name | Value | Description |
|---|---|---|
| !onTimeChange | string value |
This event occurs when the "Time range displayed" is changed. Output the selected time span (the elapsed time in milliseconds since 1970) to the variables set in the variable link in the following format. "Start time", "End time" |
■ Properties
The following table is a list of properties that can be used with this control.
For common properties for each component, see the common items page.
| Property name | Default Value | Description |
|---|---|---|
| File | - | Set the URL of the CSV setting file. |
| BeginEndTime | The elapsed time in milliseconds since 1970 of “0:00,23:59”of the current day. |
Set the begnning and ending time in the values of milliseconds since 1970 in the following format. "Start time", "End time" If the ending time is not set, it will be set to the current time automatically. It is recommended to use the !onSelect event output of the calendar component to specify this property. |
| bFireWhenTimeChanged | false | Sets whether !onTimeChange event is triggered when the value of BeginEndTime changes due to factors other than mouse/touch operation of this control. |
■ Functions
The list of available functions.
In Javascript Area, you can enter this + ".FUNCTION" to use the function.
For the common functions, please refer to common items page.
| Function Name | Argument | Return Value | Description |
|---|---|---|---|
| setFile | URL | - | Set the URL of the CSV setting file. |
| getFile | - | URL | Get the URL of the CSV setting file. |
| getBeginEndTime | - | string value |
Get the begnning and ending time of the displayed time span in the values of milliseconds since 1970 in the following format. "Start time", "End time" |
| setBeginEndTime | string value | - |
Set the begnning and ending time in the values of milliseconds since 1970 in the following format. "Start time", "End time" If the ending time is not set, it will be set to the current time automatically. The specified values are internally rounded off in minutes. |
■ Advanced Settings
The detailed properties of the ON/OFF trend allow you to set the details of what is displayed.
■ General
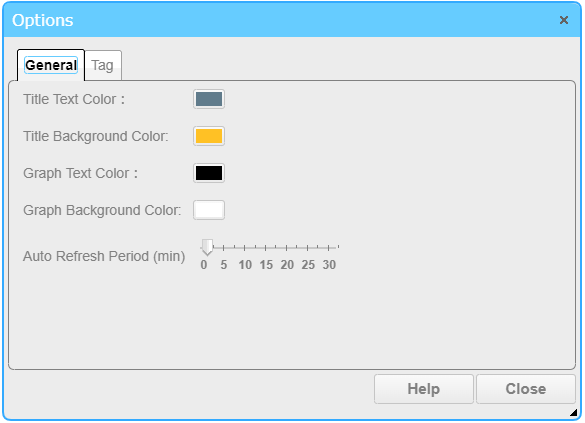
The General tab allows you to configure settings for text color, background color, etc.
□ Title Text Color
Set the color of the title.
□ Title Background Color
Set the background color of the title.
□ Graph Text Color
Set the text color of the graph.
□ Graph Background Color
Set the background color of the graph.
□ Auto Refresh Period (min)
Set the period in minutes for updating the display content automatically.
■ Tag settings
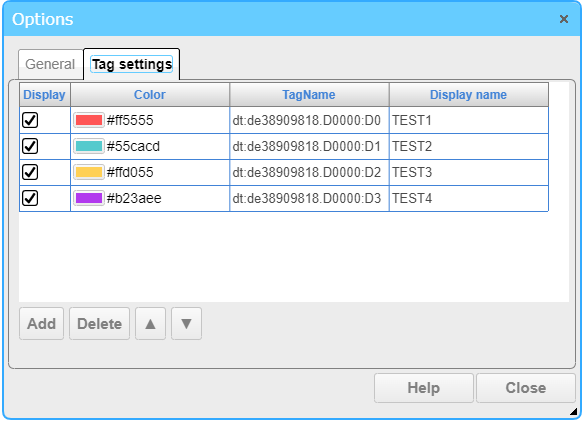
In the Tag settings tab, you can configure settings for each item's display content.
□ Display
Show or hide the trend of some tags.
□ Color
Click to open the color selection window.
□ TagName
Set the tags to be used for graph display. Press the button next to the text editor that appears after selecting a cell to display the device tree.
After selecting a tag, the data item name is automatically set to the display name of the tag.
□ Display name
Select a name to be displayed on the graph.
You can press the << button, Editing Tool for Multiple Languages is started to edit and select the string that can be switched according to the displayed language.
□ Add button
Click to add an item.
□ Delete button
Click to delete the currently selected item.
□ ▲/▼ button
Click to change the order of the listings.
□ CSV File
Import or upload graph settings from a CSV file.
The CSV file format has the following rules.
A trend chart setting occupies one line. If the string starts with "##", the line is not read in as a comment.
| Rule name | Rule contents |
|---|---|
| Delimiter |
Column delimiter : Comma(,) Line delimiter : New line characters(\r\n, or \n) |
| File encode |
UTF-8 |
| Maximum read row |
500 |
| Contents |
1st column:Set the display color. (Example: "#ff0000") 2nd column:Set the tag name that has been enabled data logger setting. (e.g. "dt:deviceID.cloudkey:tagname") 3rd column:Sets the display name for the graph. |
■ Sample CSV file
##Color,TagName,Display name
"#ff5555","dt:de38909818.D0000:D0","TEST1"
"#55cacd","dt:de38909818.D0000:D1","TEST2"
"#ffd055","dt:de38909818.D0000:D2","TEST3"
"#b23aee","dt:de38909818.D0000:D3","TEST4"
If a CSV file is set in the File property, you can use the function to read or upload the tag setting contents from the CSV file.
□ CSV Reload
The settings of the CSV file set in the File property are reloaded and reflected in the "Tag settings".
□ CSV Upload
Upload the tag settings to the CSV file set in the File property.